With Pioneer’s reportedly active divestiture process in the Delaware Basin, which is comprised of legacy Parsley Energy assets, it is important to understand the impact of a potential transaction on Pioneer’s production and key environmental metrics.
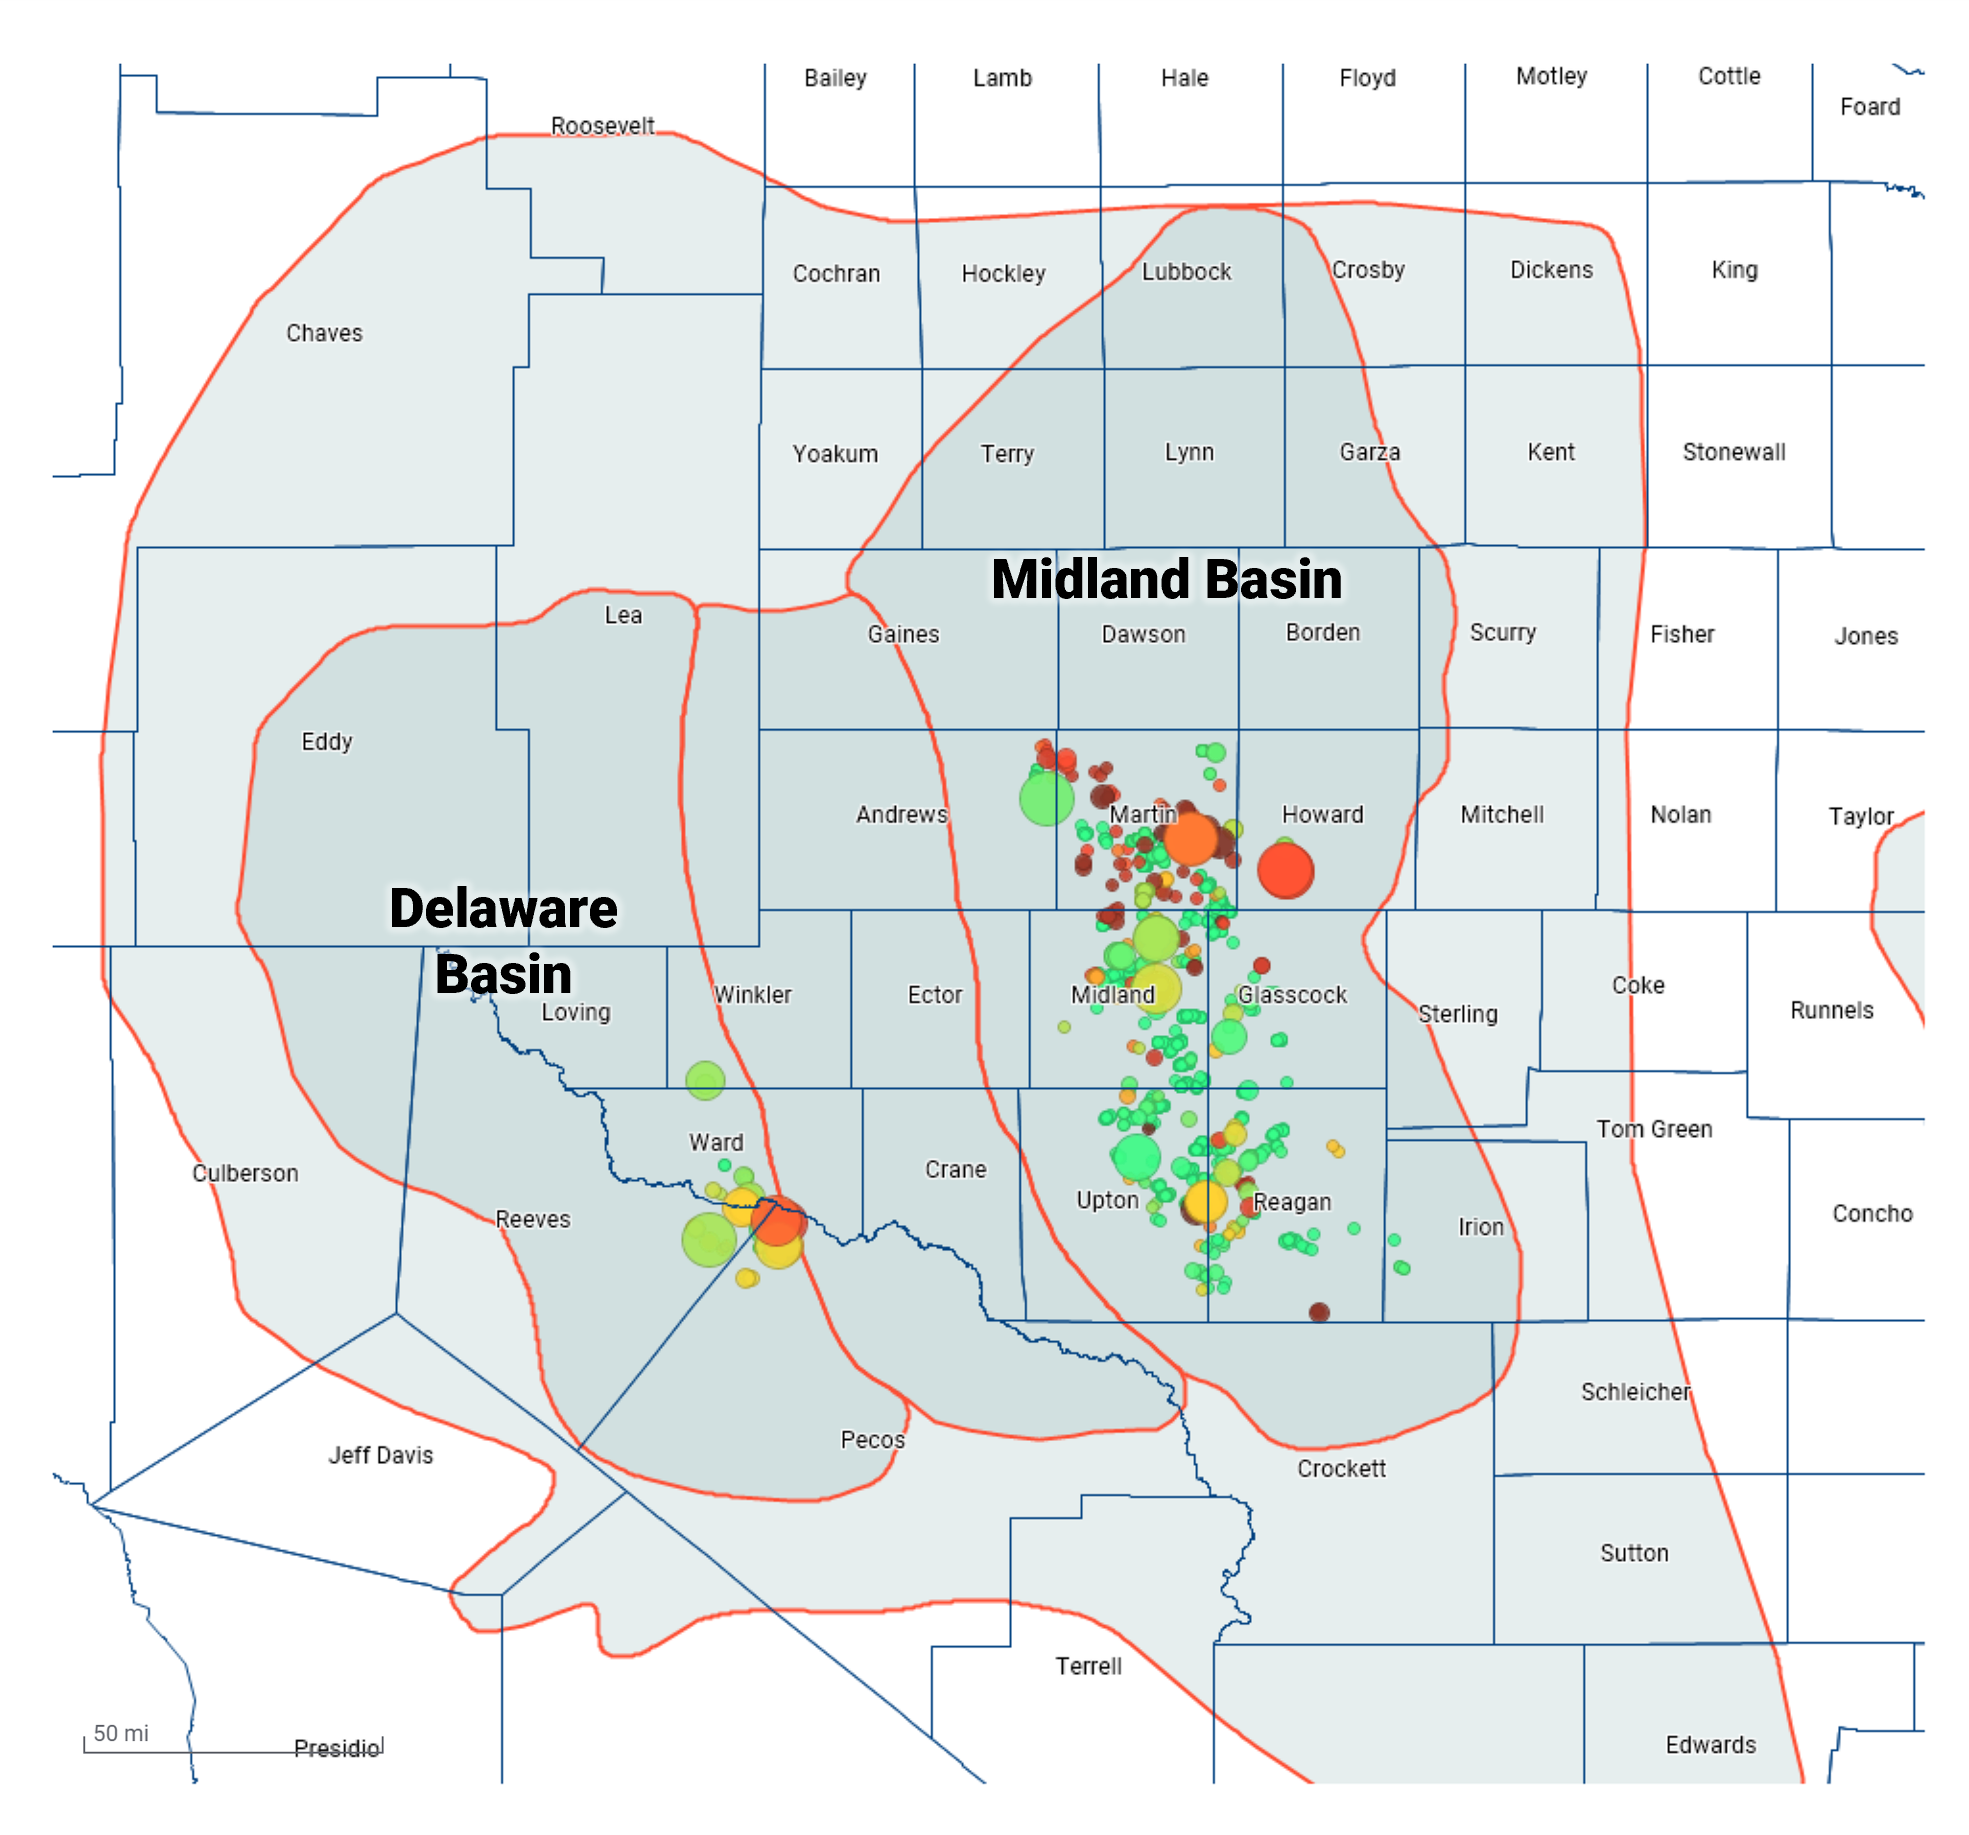
Pioneer’s “Pure-Play” asset base is split ~90-10, by acreage footprint, between the Midland and Delaware basins within the greater Permian Basin. The Midland Basin asset is set in the top tier core with highly continuous acreage. In slight contrast, the Delaware Basin position is about 10% of the company’s acreage – still a respectable ~100,000 acres – located in the southeastern part of the sub-basin and has more competition to claim the top tier acreage spot across it. Pioneer’s position represents the combined footprint of Pioneer and recently acquired DE3 Operating (entirely in the Midland Basin).
Pioneer's operated leasehold with reported flaring, current as of May 2021. Color scheme represents flaring intensity and bubble size that of relative flaring rate.
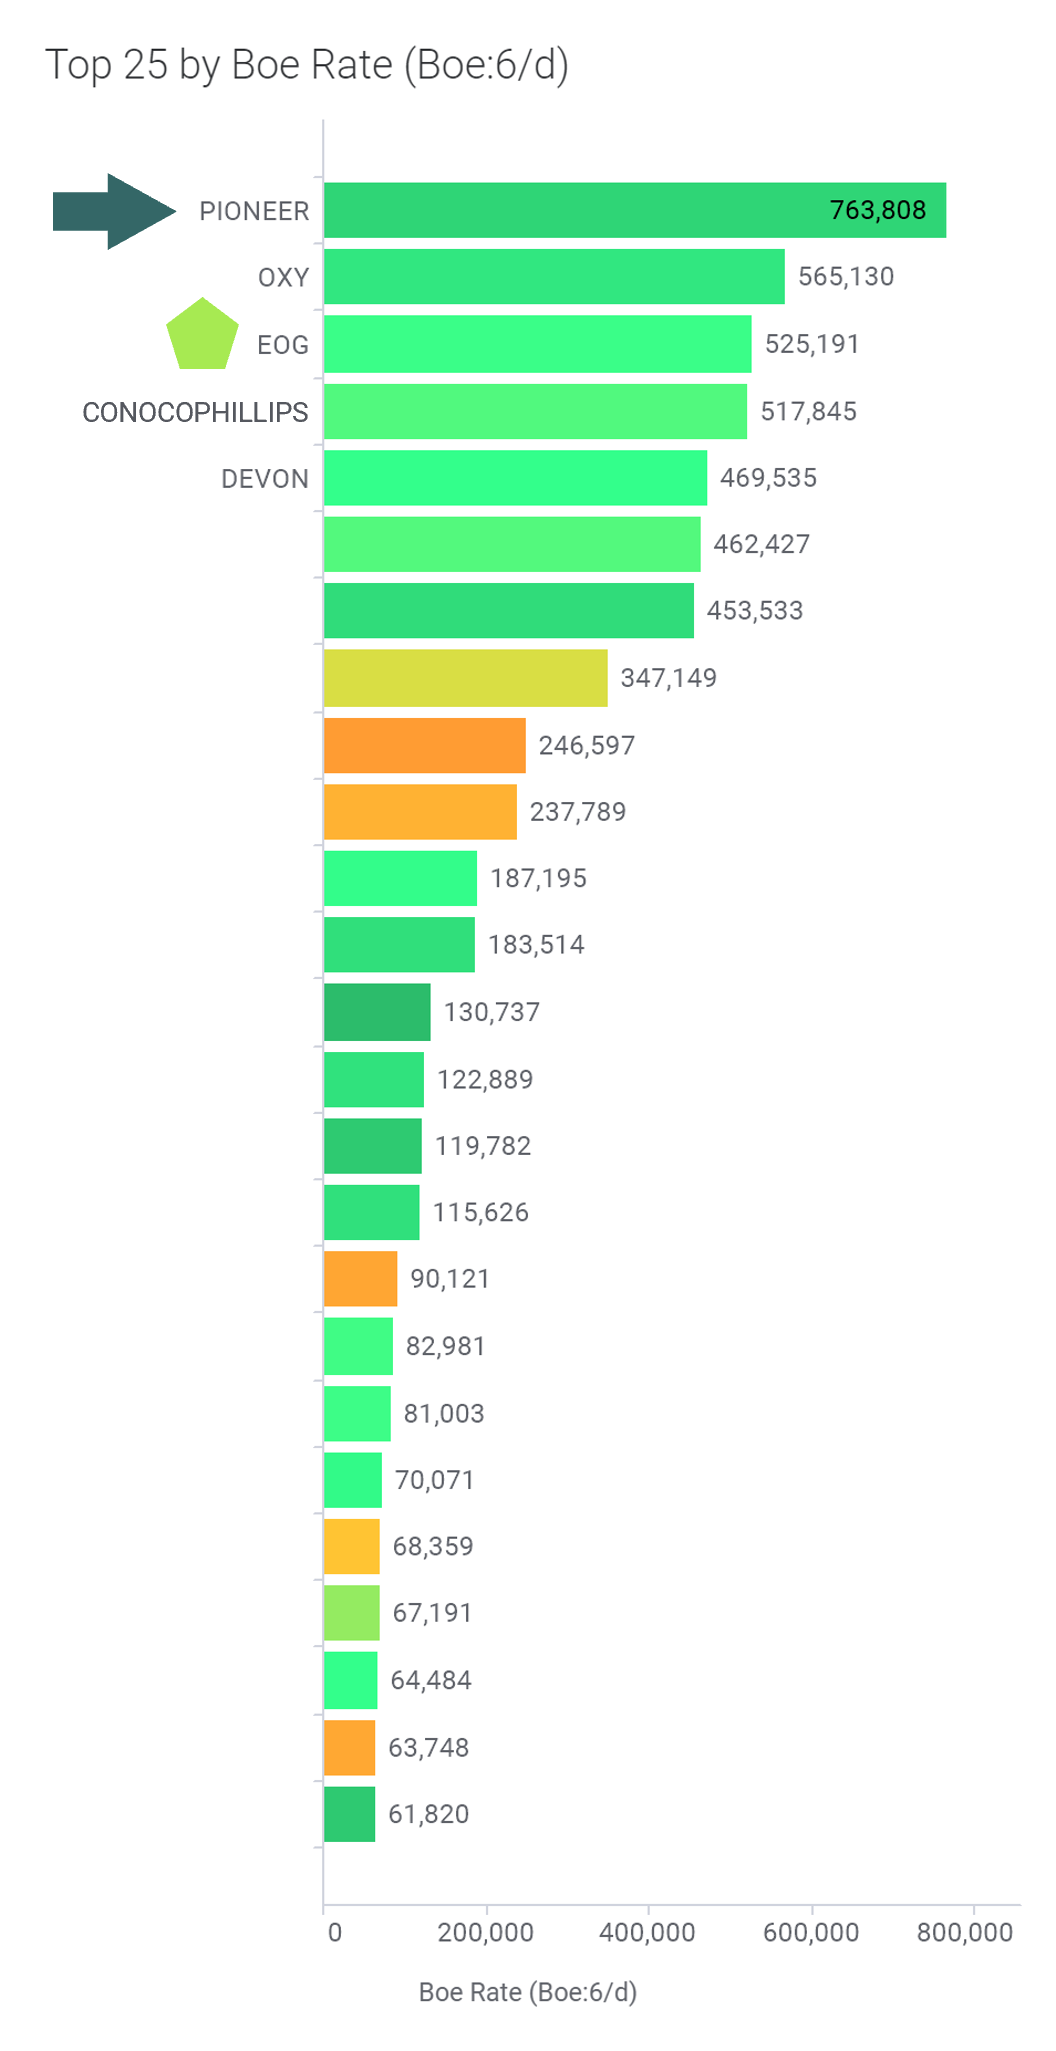
Pioneer claims the helm of the Permian Basin production
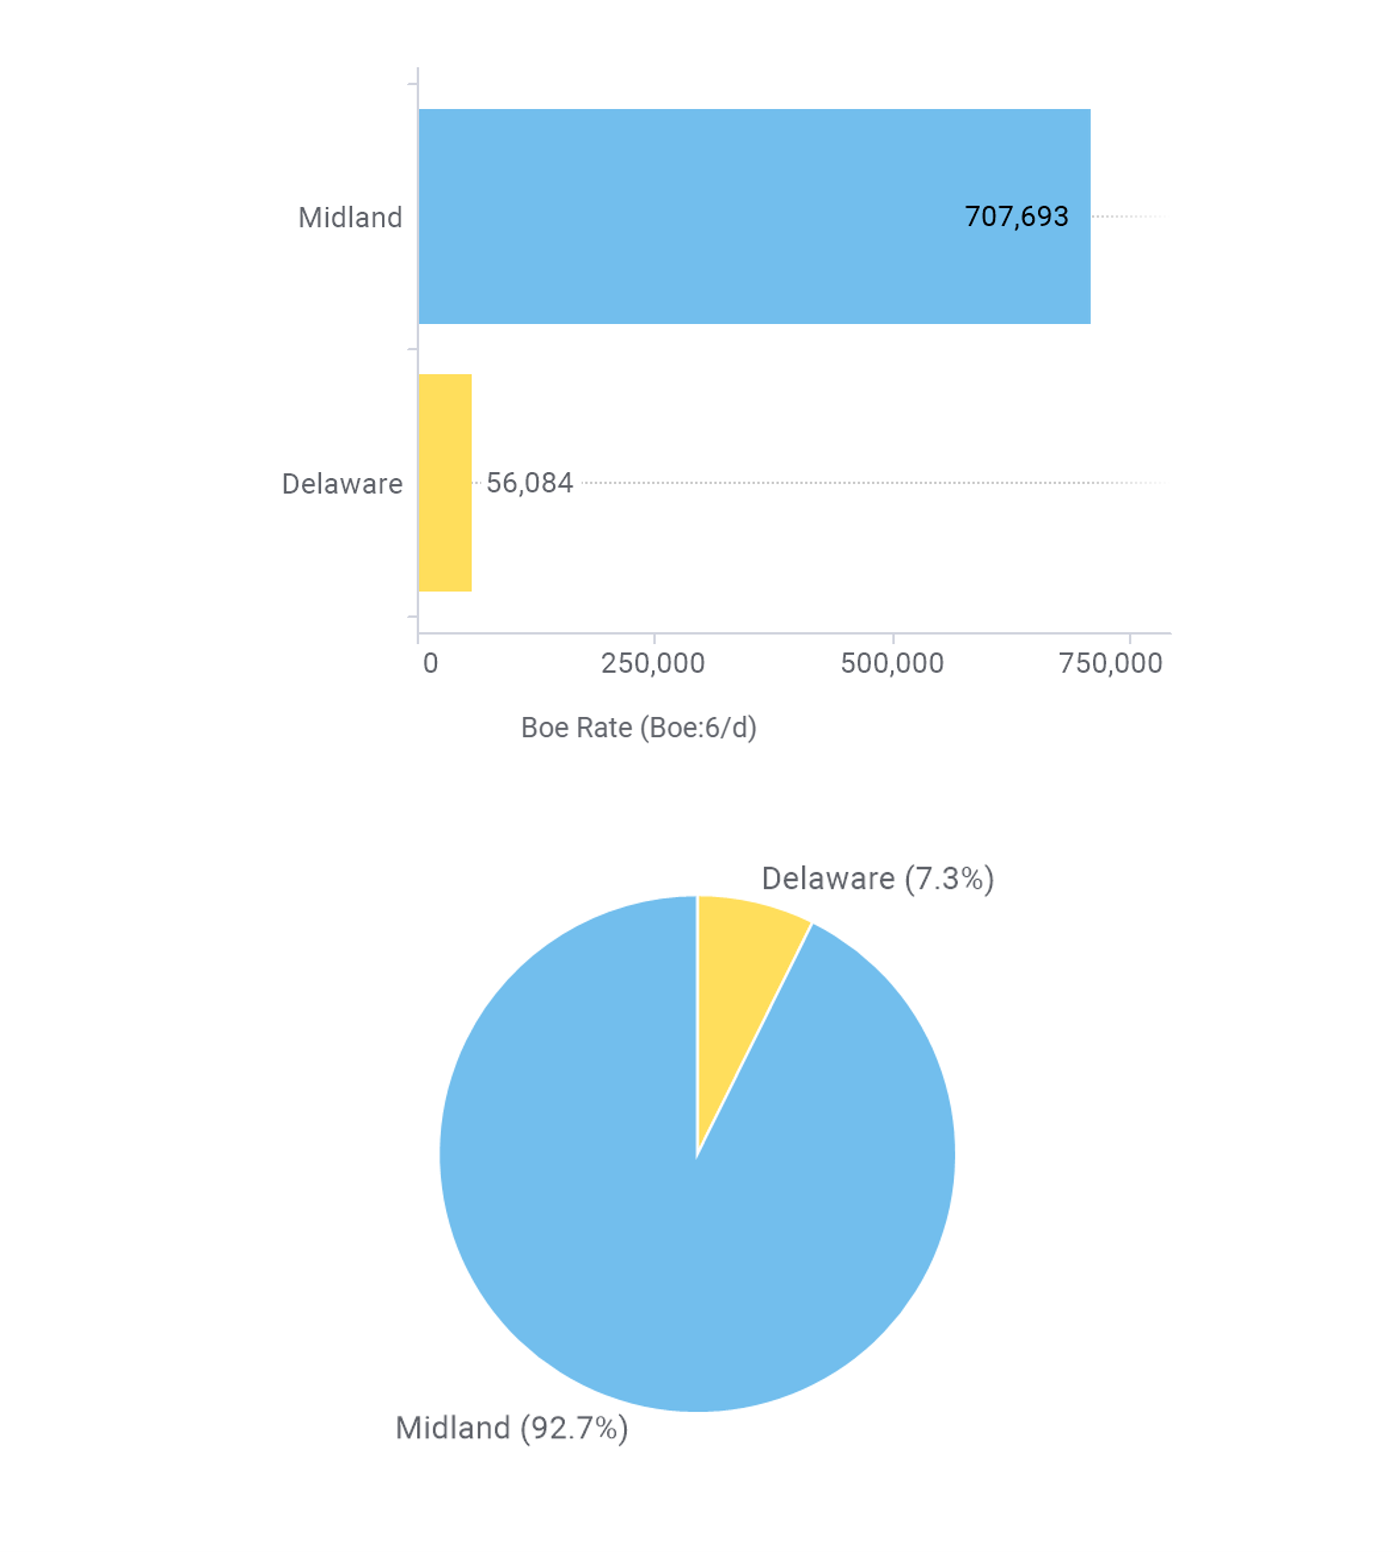
Pioneer claims the top spot in the Permian Basin by gross operated production (Boe:6/day).
Color scheme represents gas-oil-ratio (GOR).
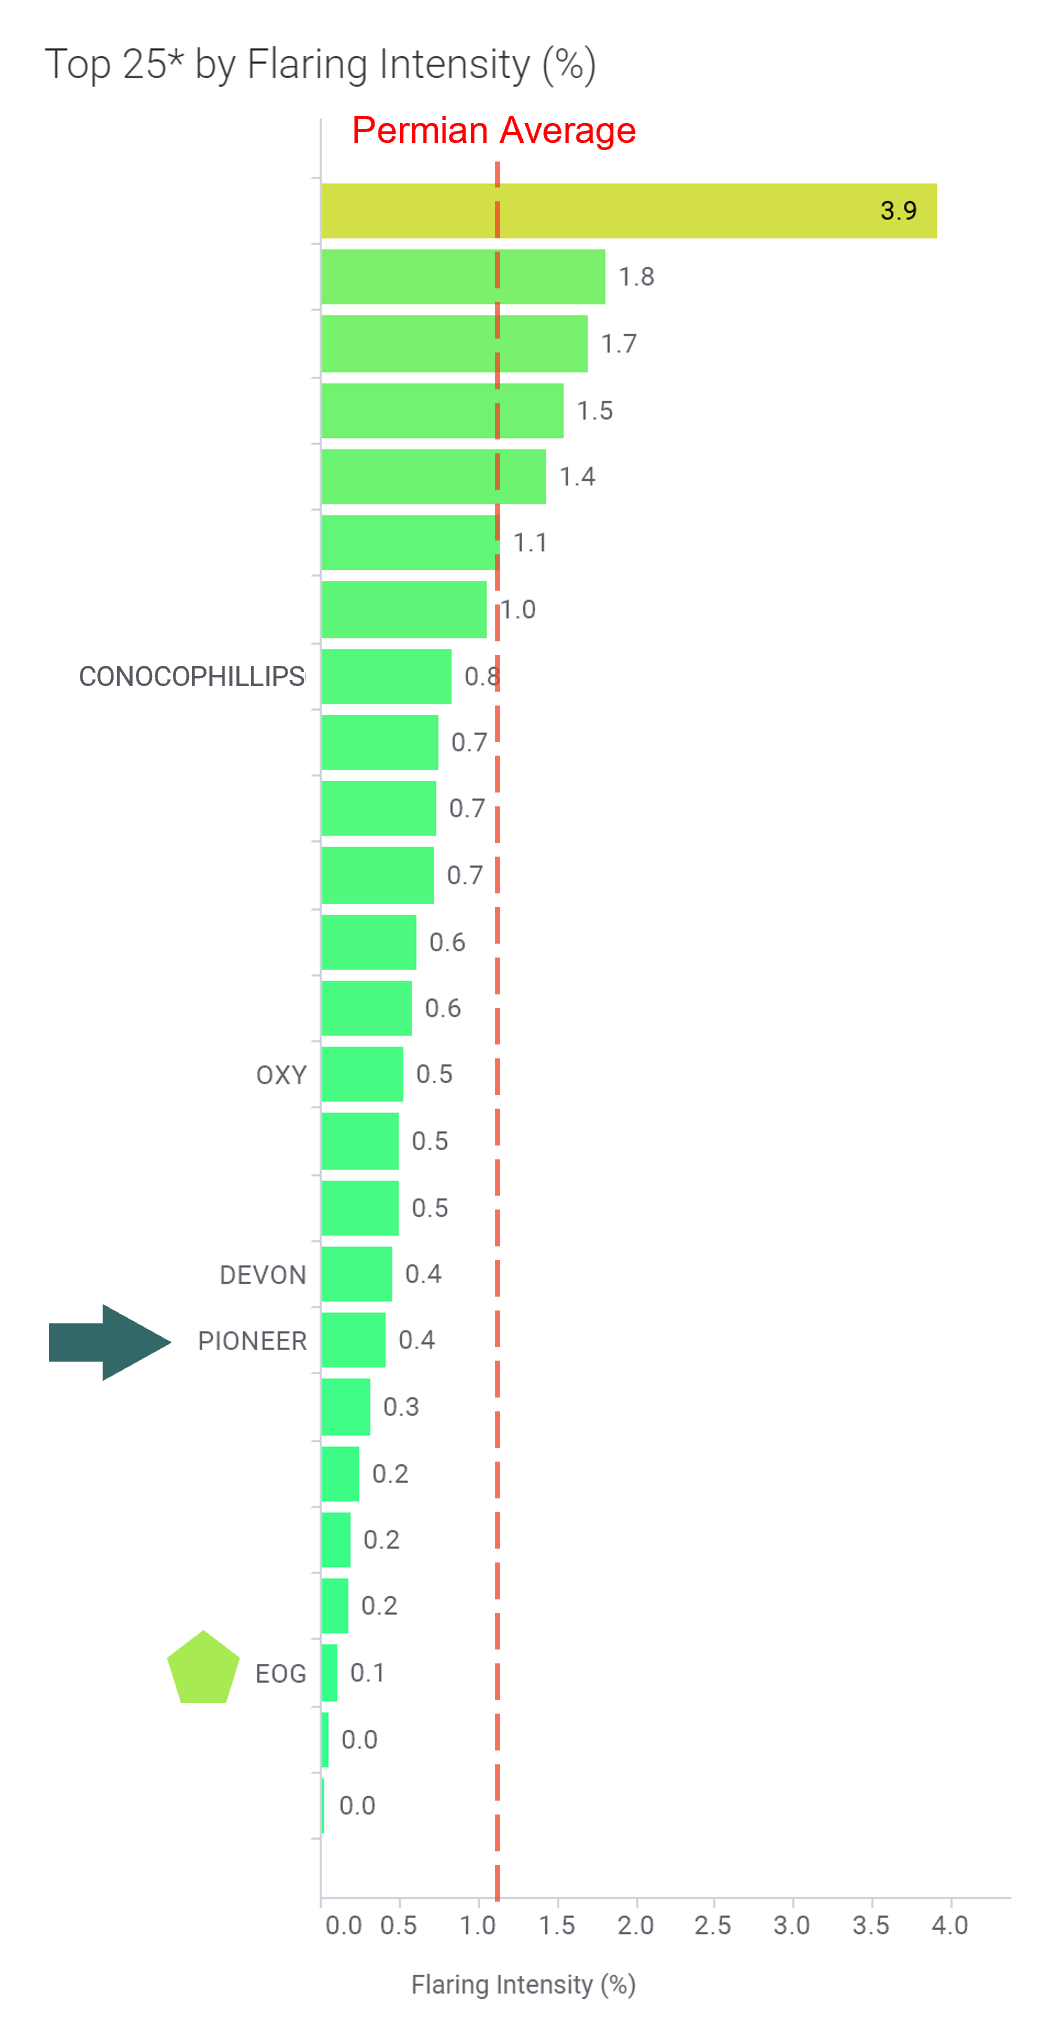
How does Pioneer’s environmental performance compare to the Permian Basin peer group?
Pioneer continues to improve on flaring rate and intensity, achieving 4,100 Mcf/d rate or 0.31% intensity in March 2021 – a 91% decrease in rate from 44,700 Mcf/d (4.68% intensity) in November 2018. The flaring stands at 5,900 Mcf/d and 0.41% as of May 2021.
*Top 25 in reference to Top 25 Permian Basin producers.
Its hard not to highlight EOG’s performance in the same analysis. EOG has been on a steady mission to decrease flaring – achieving 0.09% in May 2021 (1,200 Mcf/d) or a 92% decrease in rate from a high of 15,500 Mcf/d (2.04% intensity) in October 2018.
Gas flaring continues to be an area of focus and a crucially important metric as gas flared leads to emissions without useful energy delivery, especially if done for purposes other than safe oilfield operations.
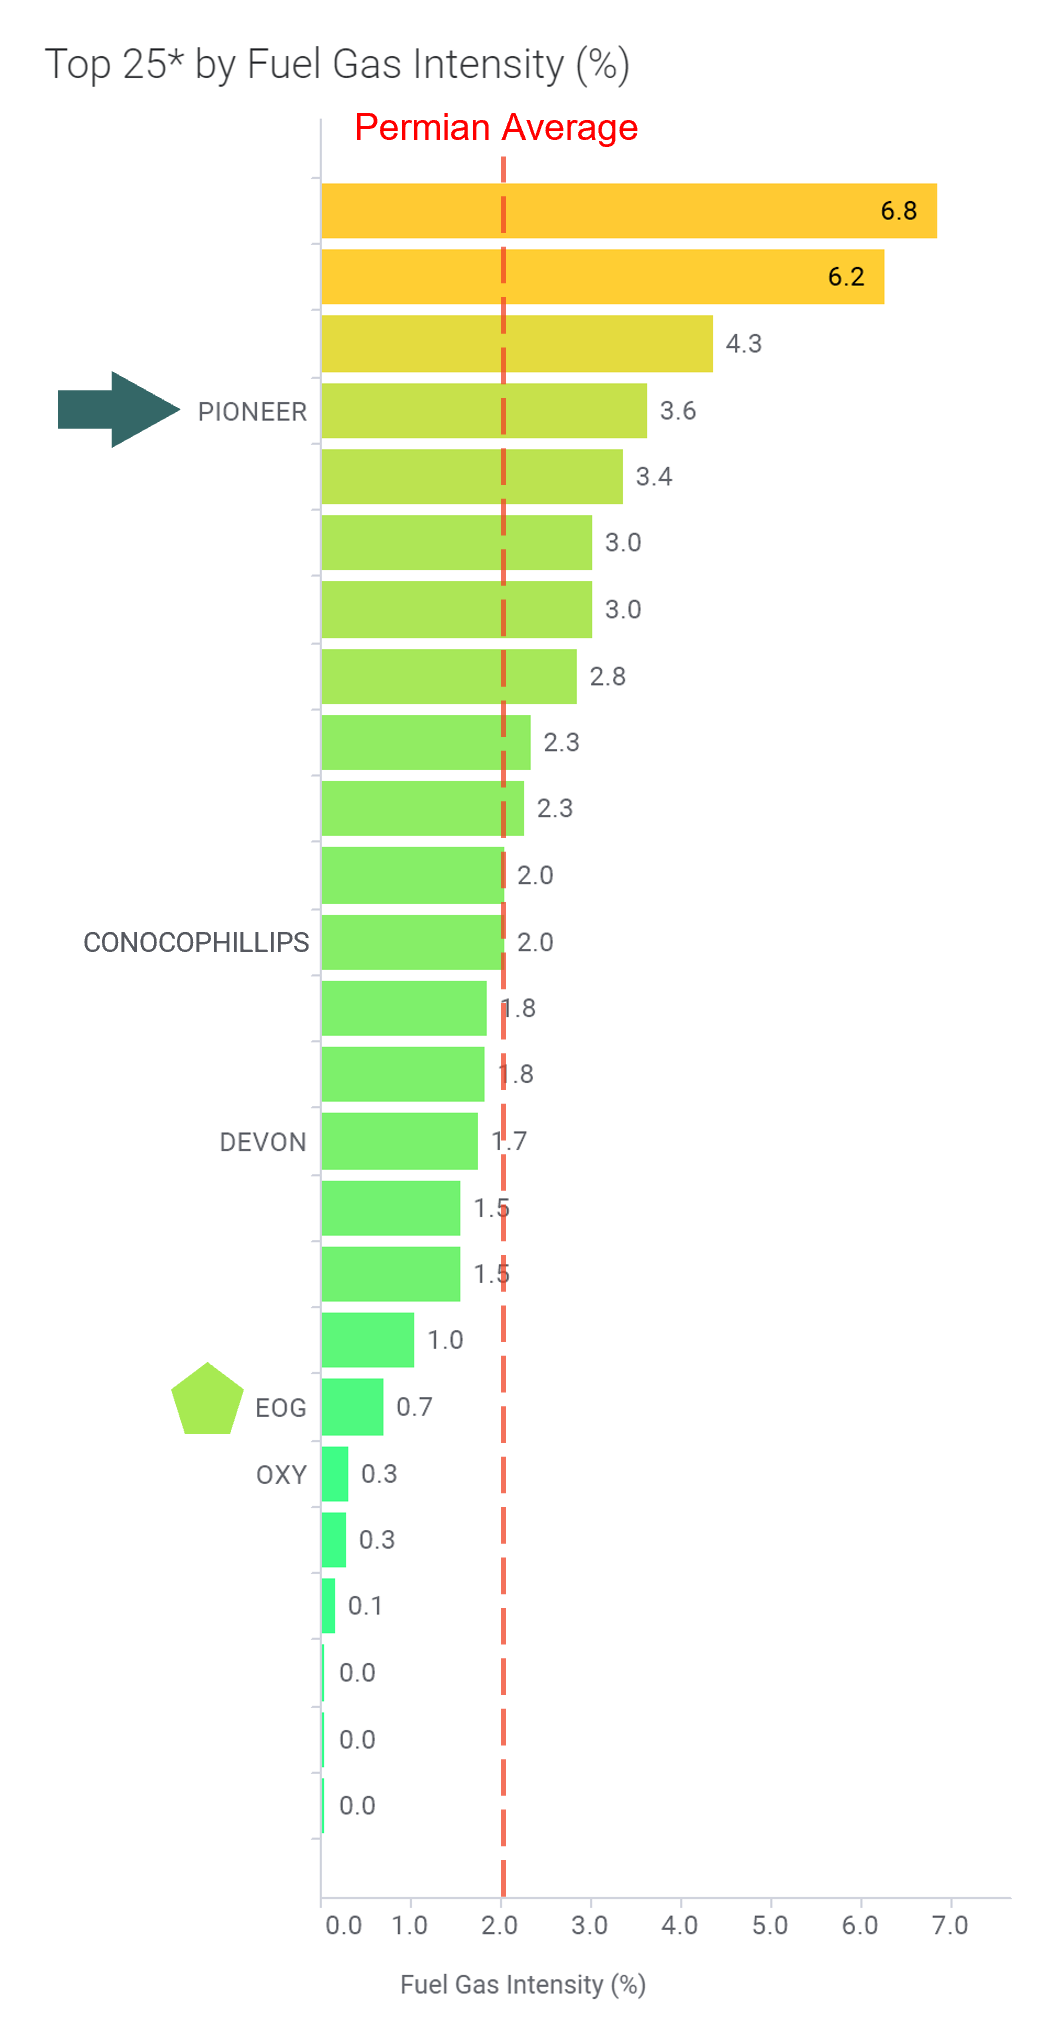
On fuel gas use, Pioneer’s intensity stood at a 4-year low in August 2020 at 3.21% and has increased since to 3.62%; though the rate of usage has been on a steady climb from 33,900 Mcf/d in January 2018 to 52,700 Mcf/d in May 2021 (a 55% increase) – gas production has increased by >200% over the same period.
*Top 25 in reference to Top 25 Permian Basin producers.
EOG’s fuel gas intensity stands at 0.69% compared to 2.04% Permian Basin aggregate, though close to peak rate over the past 4 years at 8,800 Mcf/d – an increase of 191% since January 2018 – gas production has increased by 274% over the same period.
Fuel gas use may be an indicator of various operations related power needs. One of the areas of required continued focus is the electrification of the oilfield, though challenges persist in grid availability and reliability. Centralized electrification leads to lower emissions and a lesser surface footprint. Though the gas is combusted vs. flared, the emissions profile is still significant. This makes it an important environmental metric to track, and as it relates to operator Scope 1 emissions.
How does Pioneer’s Midland Basin flaring compare to the Delaware?
An overwhelming 92.7% of Pioneer’s production (Boe:6/day) is in the Midland Basin.
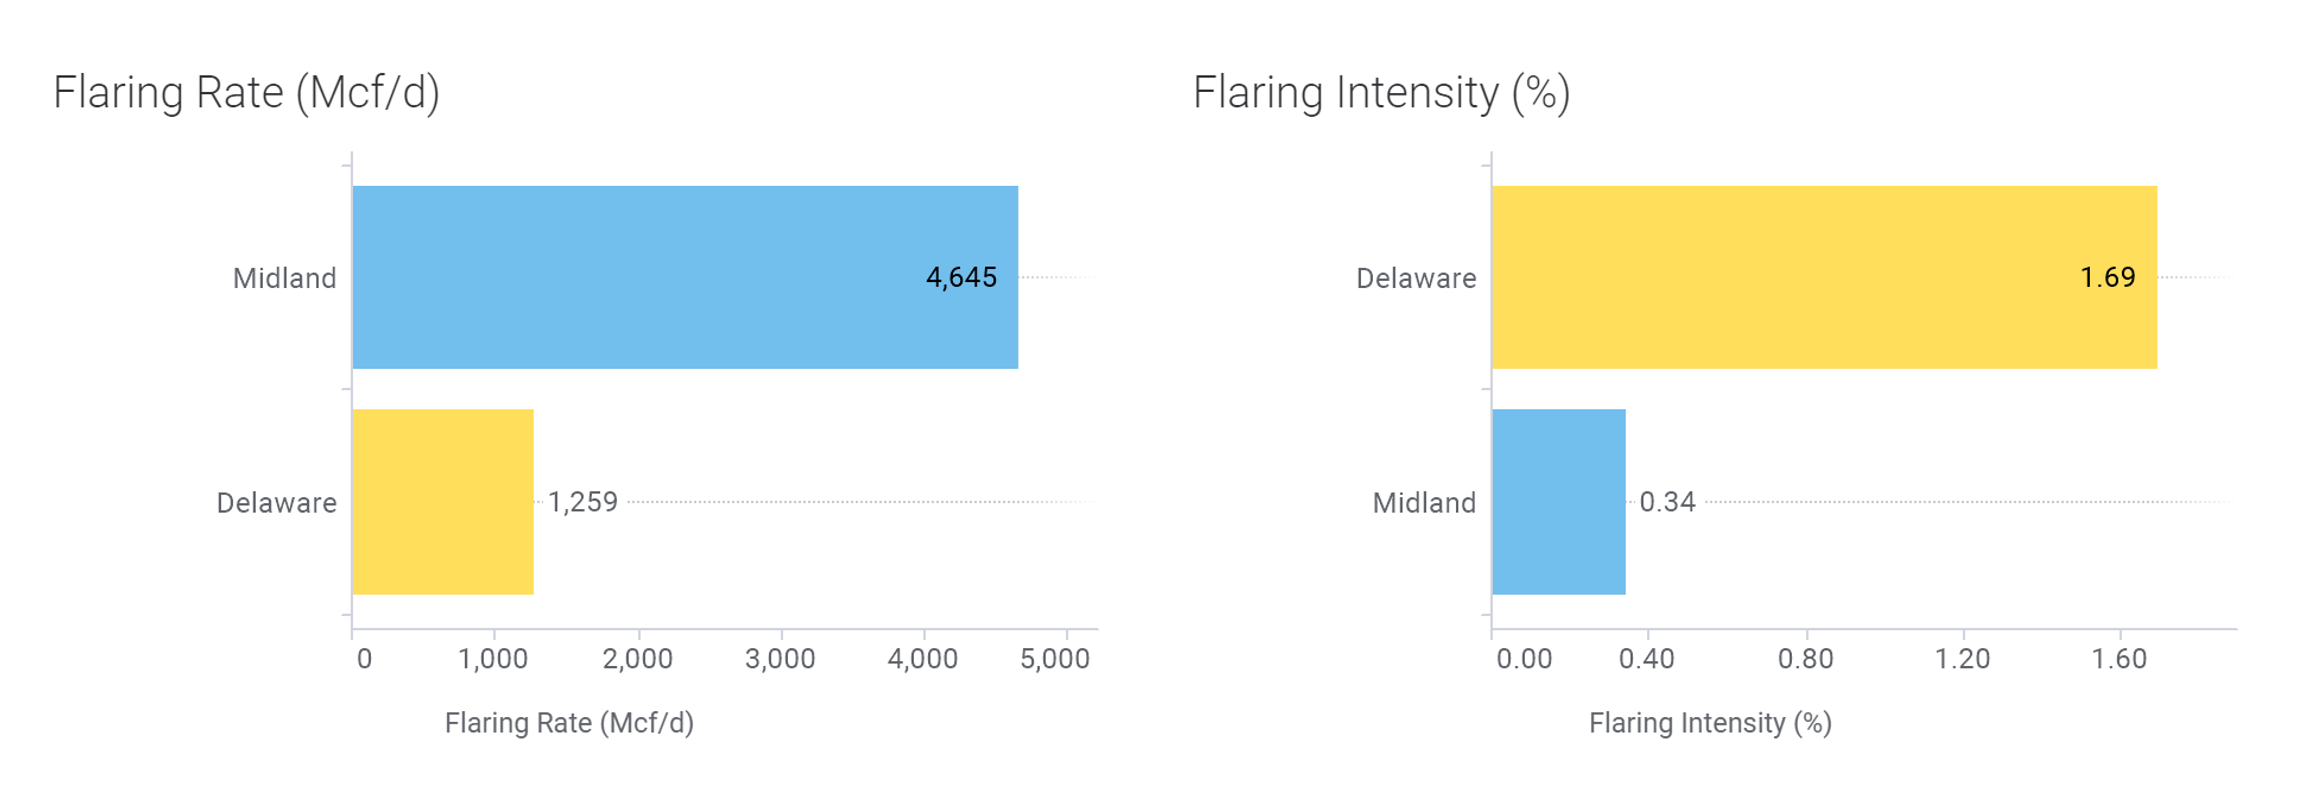
Pioneer’s Delaware Basin flaring rate accounts for 21.3% of the total but at significantly higher intensity than the Midland Basin assets.
Divestiture of the Delaware Basin assets would reduce Pioneer’s gross operated production by 7.3%, while reducing the flaring rate by 21.3% and intensity by 17.1% (to 0.34%) – the deal would noticeably improve the company’s flaring metrics. The Permian Basin aggregate flaring intensity stands at 1.1%.
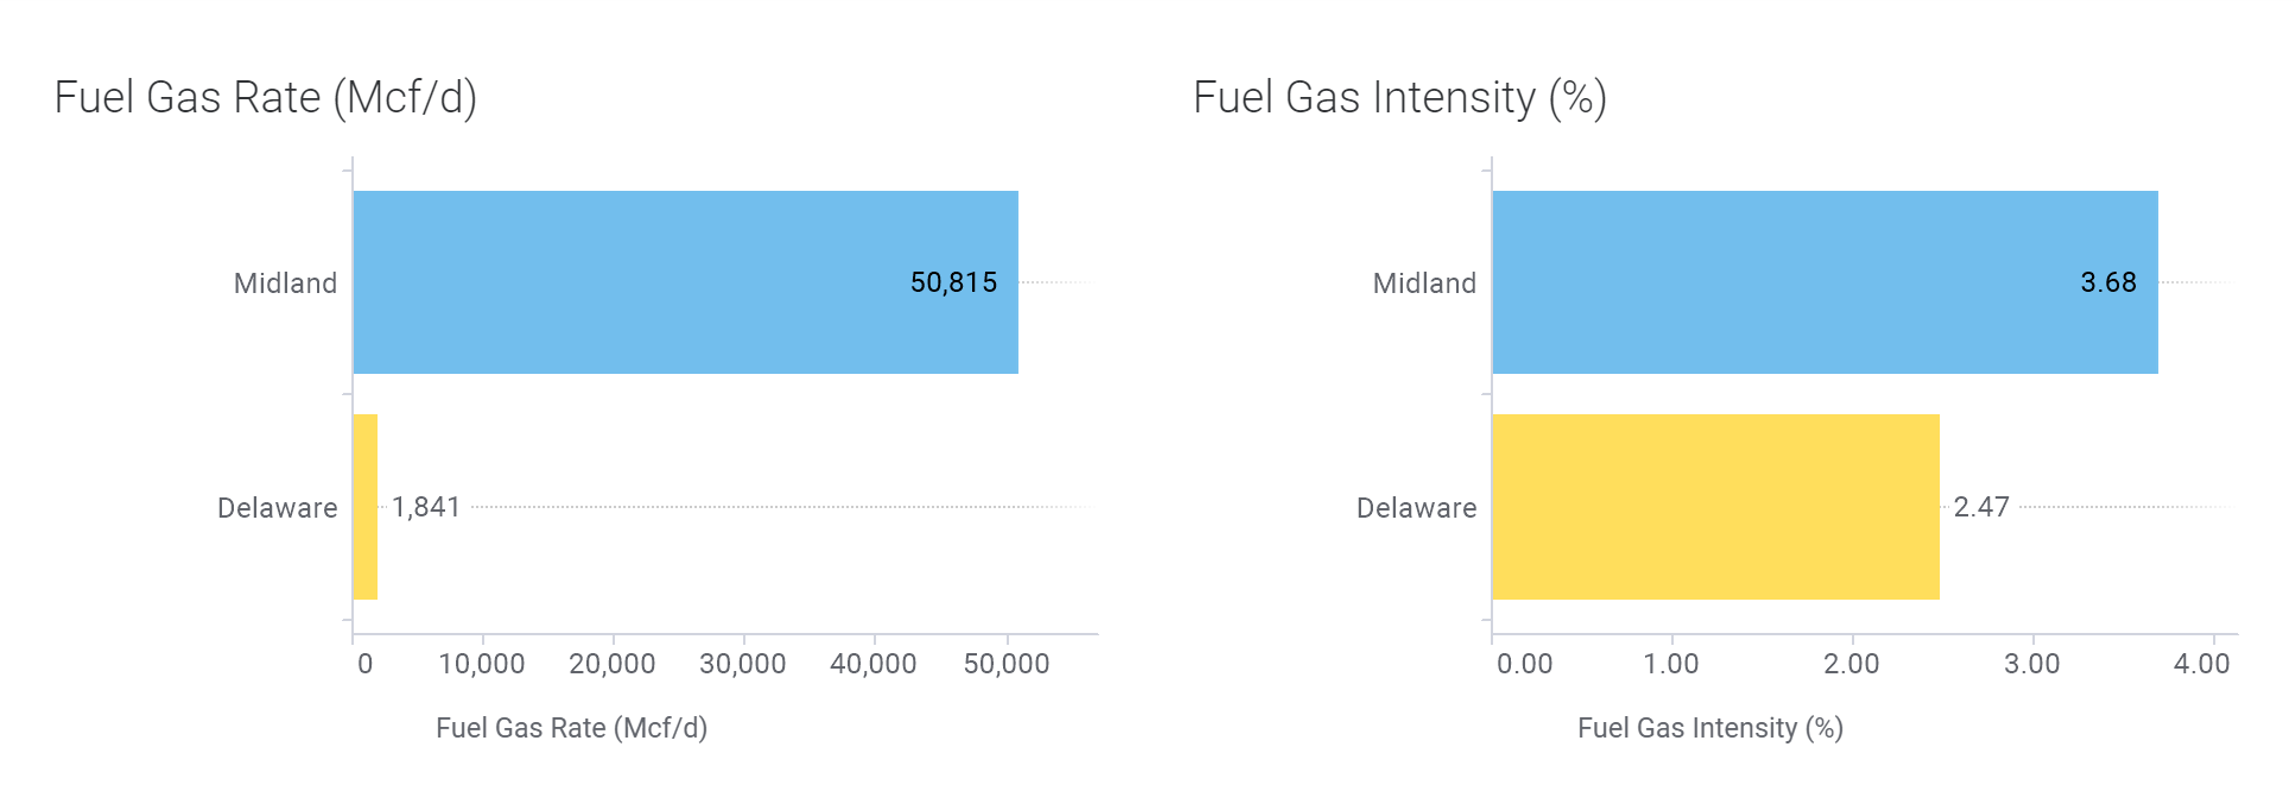
Pioneer’s Midland Basin fuel gas use rate accounts for 96.5% of the total and at higher intensity than the Delaware Basin, though both areas are over the Permian Basin aggregate fuel gas intensity of 2.04%.
Divestiture of the Delaware Basin assets would not have much of an impact on the company’s fuel gas use metrics. Continued improvements in operational practices needed to drive reductions over time.
NOTE: Data in this report is current as of May 2021 and based on gross operated leasehold volumes.